Thanks to fragmented attention spans, any massive mountain of data takes hours of reading. With Gemini 3 Pro series powering the impressive Deep Research agent, you can gather incredible amounts of context from across the open web. But it doesn't quite solve the time and comprehension speed bumps.
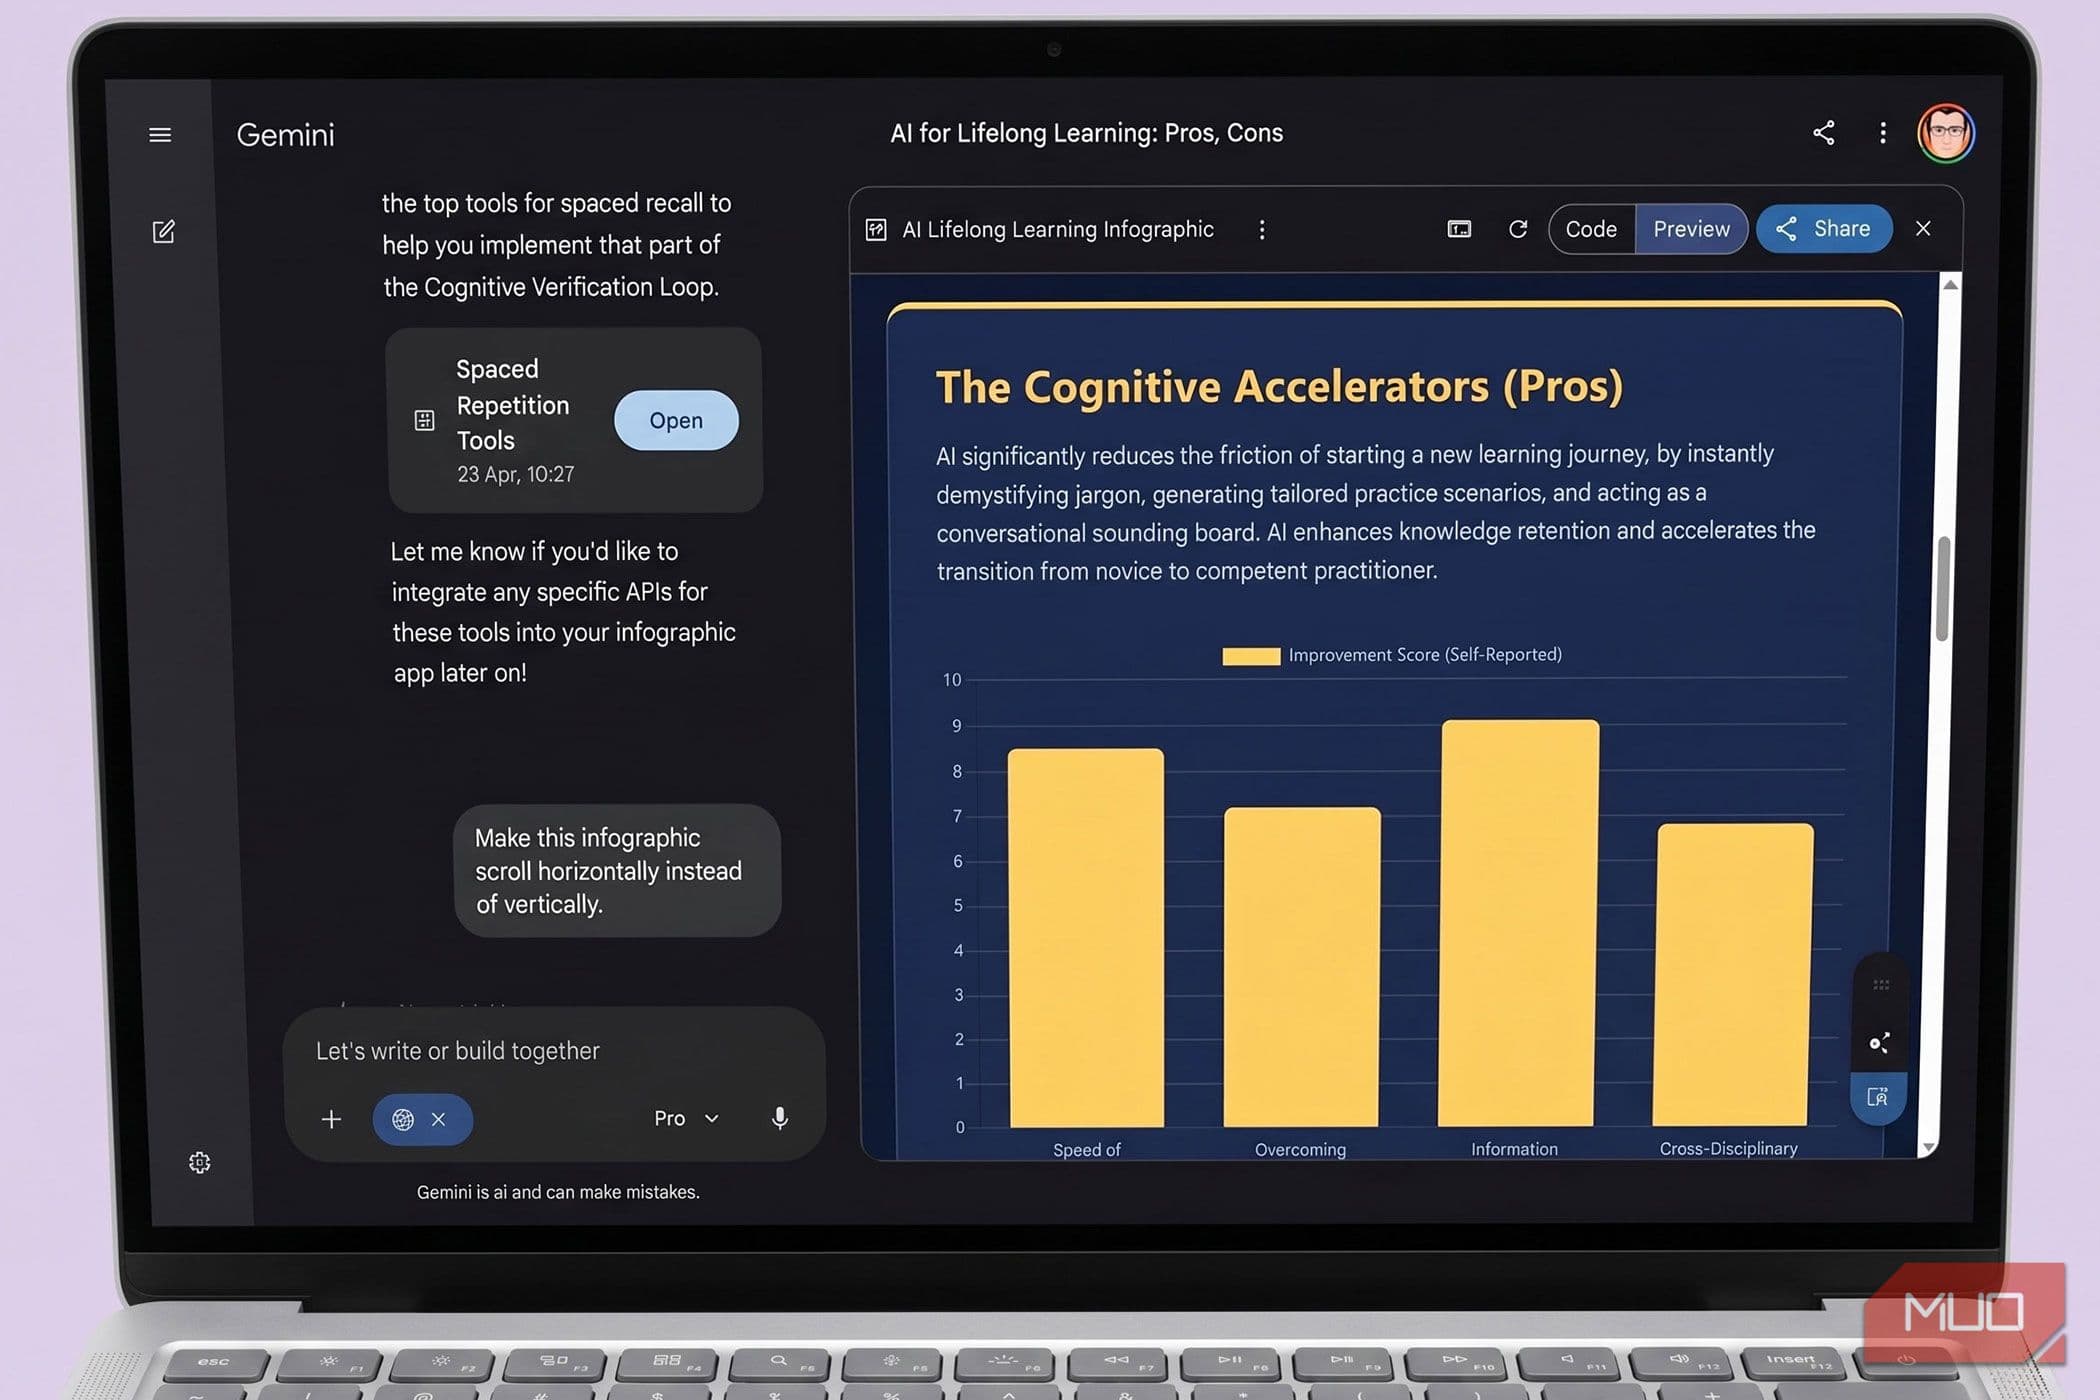
One solution is to transform those detailed findings into native infographics right inside Gemini. I tried this workflow to summarize dense topics and generate a visual map of the material. I am always surprised by the professional-level infographics and how interactive they can get. It's a neat presentation tool that can blow PowerPoint out of the water if done right.